Pythagorean Expectation in the NBA, NHL, NFL, and MLB
- Ryan Kyaw

- Feb 1, 2022
- 5 min read
Created by Bill James, the Pythagorean expectation formula attempts to determine the winning percentage of sports team based on the number of runs or goals scored and allowed. Originally intended for baseball, sports analysts have discovered that Pythagorean expectation can be valuable in other sports such as basketball, hockey, football, soccer, and much more. The original formula looks like this:
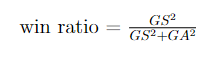
The original exponent that James came up with was 2. However, this exponent has been optimized for different sports in recent years, and we will also be doing our own analysis of this exponent.
Baseball:
Using data from the 2017-2021 MLB seasons from baseball-reference.com, we can figure out which exponent gives us the lowest average error in predicting win percentage. Here is a graph of all the exponent values that we tried versus its corresponding mean absolute deviation (average of the absolute value of the difference between true win percentage and Pythagorean win percentage):
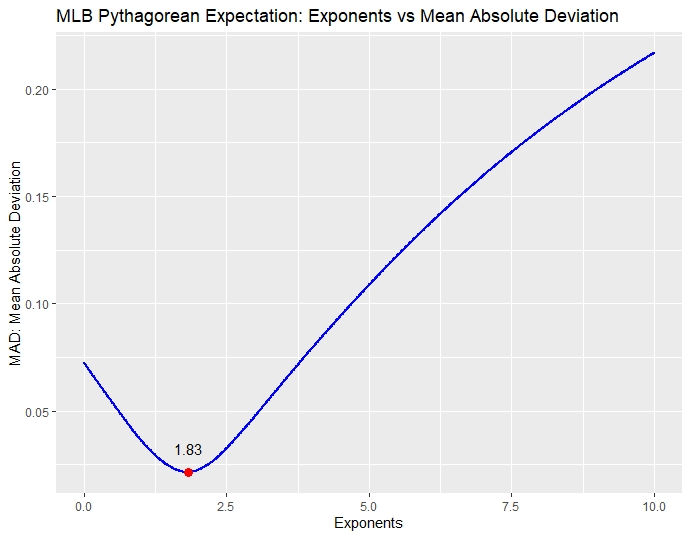
From the graph we see that the minimum MAD value comes when our Pythagorean exponent is 1.83. Here is the 2021 MLB standings with each team's corresponding Pythagorean win/loss ratio with the 1.83 exponent.
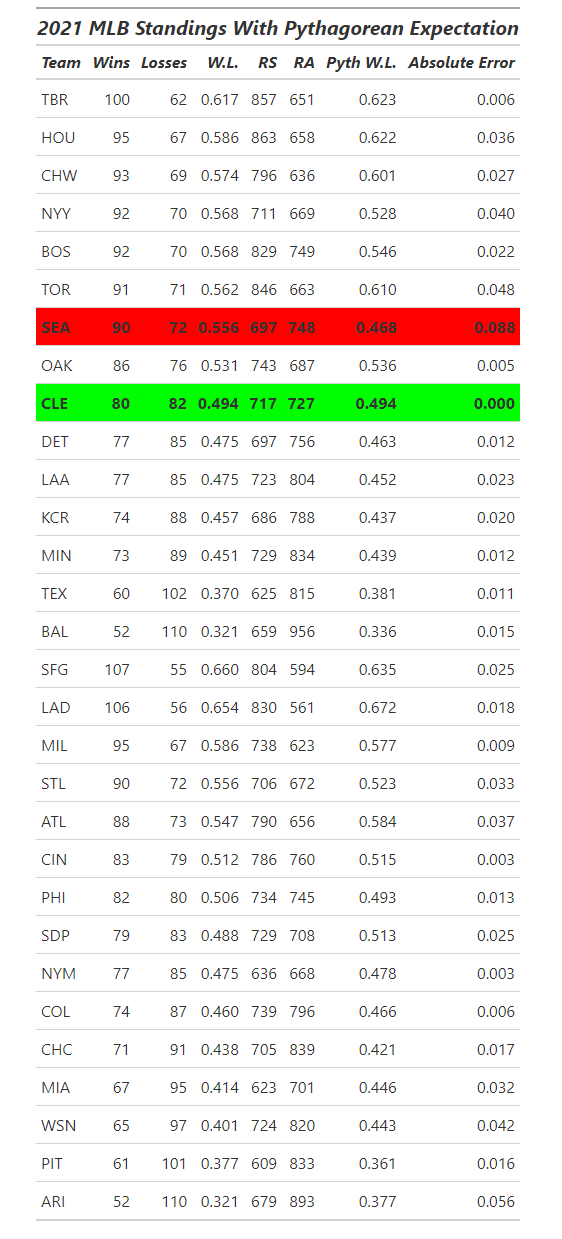
In the red, we see that the Seattle Mariners outperformed their Pythagorean expectation by almost 9 percent. In the green, we see that the Cleveland Indians actually performed exactly to their Pythagorean expectation.
Using the exponent of 1.83, the MAD among the 5 seasons of data that we have from baseball reference is 0.021. This means that on average, our Pythagorean win/loss was off by 2%, which equates to about 3 games in a 162 game regular season.
We can also use Pythagorean expectation to predict how many runs a team needs to score in order to gain wins. We can use the average runs scored of a baseball team to see how many more runs are needed for an average MLB team to win one more game. From 2017-2021, the average runs scored in a season was 653.55 runs. We will assume that the average MLB team scores and allows 653.55 runs. As one would expect, a team that scores and allows the same amount of runs would be expected to win half their games. Now, we can keep the runs allowed number constant, while increasing the runs scored to see how that affect expected wins. A graph of that is displayed below.
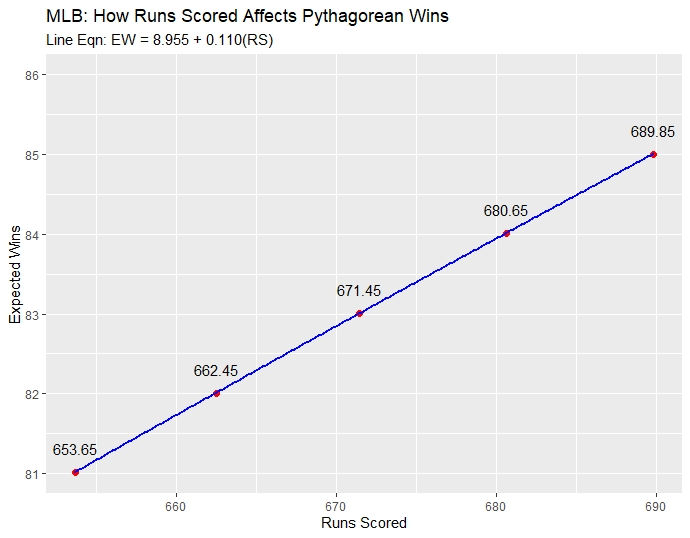
We have a linear relationship, and the equation of this line shows that as runs scored increases by 1, expected wins increases by 0.11. This also implies that as runs scored increases by 9, expected wins increased by 0.11*9, which is almost 1. Thus, we can also conclude that for an average MLB team to get better by 1 win, they would have to score 9 more runs.
To highlight the power of Pythagorean expectation, we will compare using the first half W.L and Pythagorean W.L to predict the second half of the 2019 MLB season. Here are the standings from the first half of the 2019 MLB season:

Using each team's corresponding W.L and Pythagorean W.L percentages, here is how they compare to the standings for the second half of the season:

Here, "Exp Pyth WL" is each team's Pythagorean win/loss from the first half, and "Exp WL" is each team's actual win/loss from the second half. Further analysis shows that the correlation coefficient between actual second half win/loss and "Exp Pyth WL" is 0.71 while the correlation coefficient between actual second half win/loss and "Exp WL" is 0.67. Thus, for the 2019 MLB season there was more predictive power in using Pythagorean win/loss to predict the second half season that each team's actual first half records.
Now, this doesn't happen every season in every sport, but it highlights the power and importance of Pythagorean expectation. Let's look at Pythagorean expectation in the other major American sports.
Basketball:
For the NBA, we used data from basketball-reference.com to gather data from the 2017-2021 NBA seasons. Here is the graph of exponents versus mean absolute deviation in Pythagorean expectation and actual win/loss:
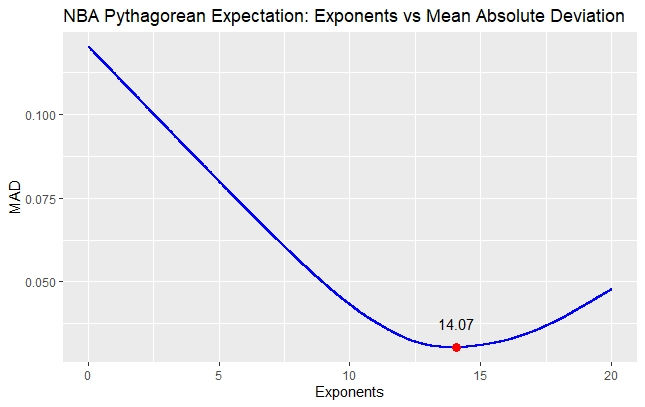
Here, we see that the optimal exponent is 14.07, and the MAD with this exponent ended up being 0.0304. In other words, our Pythagorean expectation if off by about 3% which equates to roughly 2.5 games in an 82 game NBA regular season. I'd say this is a pretty good error rate.
The average points scored by an NBA team during a season from 2017-2021 was about 8492 points. Using this data, we perform a similar process to what was described in the baseball section to see that it would take an average team about 30 points to gain a win over the course of an 82 game regular season.
Hockey:
Using data from the 2017-2021 seasons in the NHL from hockey-reference.com, here is the graph of exponents versus MAD:
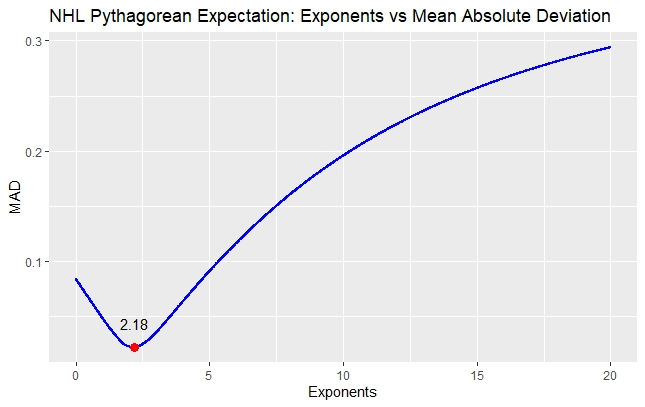
For the NHL, we have to specify that 2.18 is optimal for predicting true win percentage, discounting overtime losses which awards an NHL 1 point. To predict points percentage, the exponent of 2.05 ends up being optimal. The MAD for predicting true win percentage is 0.022, while for points percentage it is 0.057. This equates to being off by less than 5 games over the course of an 82 game regular season.
Using the exponent of 2.18, we can also conclude that an average NHL team would need to score almost 5 more goals a season to gain one more win.
Football:
Using football-reference.com, we gathered the data from the 2016-2020 NFL seasons, and here is the relationship between exponents and MAD:
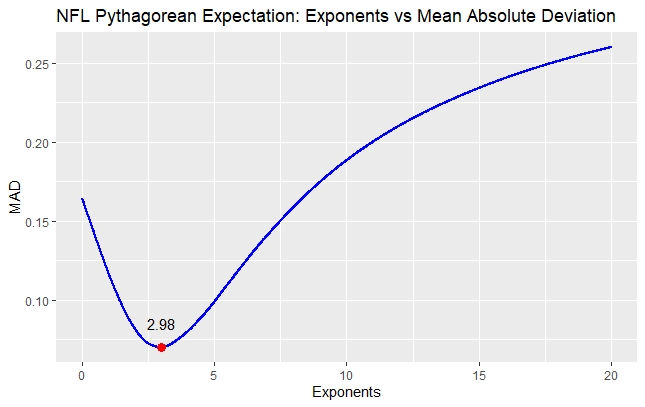
Now, in the NFL regular season we do have ties to consider. However, for the purposes of our calculations, since they happen so infrequently, we will ignore ties. Interesting, data from the last 5 seasons shows that the optimal exponent is 2.98. This goes against the accepted optimal exponent for the NFL that is agreed to be 2.37.
Using the 2.98 exponent, we can conclude that an average NFL scoring about 42 more points per season would gain a win.
In conclusion, Pythagorean expectation is a valuable tool to analyze the true skill level of sports teams. Looking at point differential or run differential can be valuable to see who the overperforming and underperforming teams each season. Most of the time, teams are not able to sustain an overperformance or underperformance to their Pythagorean expectation throughout the course of an entire regular season.
Just over a month ago, we use Pythagorean expectation to predict the remainder of the NBA and NHL seasons. At then conclusion of those seasons, I will go over how well or poor Pythagorean expectation did.
If you have any questions, please email me at ryankyaw6@gmail.com, or message me on Twitter (@ryank_08) or Instagram (@ryan8kyaw).


Comments