The Overperforming and Underperforming Teams of the 2021-2022 NHL Season
- Ryan Kyaw

- Dec 19, 2021
- 3 min read
We are about 1/3 of the way through the 2021-2022 NHL Season. A small sample size, but there is some data we can analyze to determine the overperforming and underperforming teams of the season so far.
Devised by Bill James to estimate the true proportion of games a baseball team "should" have won, Pythagorean expectation is a formula that assesses the runs/goals/points scored and allowed by a team to determine a winning proportion. The formula is displayed below:
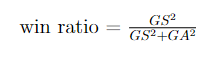
where GS represents goals scored and GS represents goals allowed. Now, the initial formula created by James used the exponent of 2. However, different estimation techniques have been done in recent decades to optimize this exponent. See https://web.williams.edu/Mathematics/sjmiller/public_html/math/papers/DayaratnaMiller_HockeyFinal.pdf for more information about how the exponent was optimized for NHL data. We use an exponent of 2.1 for our calculations.
This is a table of the NHL standings as of 12/17/2021 with the Pythagorean win/loss data for each team. As a note, Pythagorean expectation does not separate overtime losses and regular losses. Thus, for the sake of our calculations, we will treat both types of losses as the same (variable = total losses).
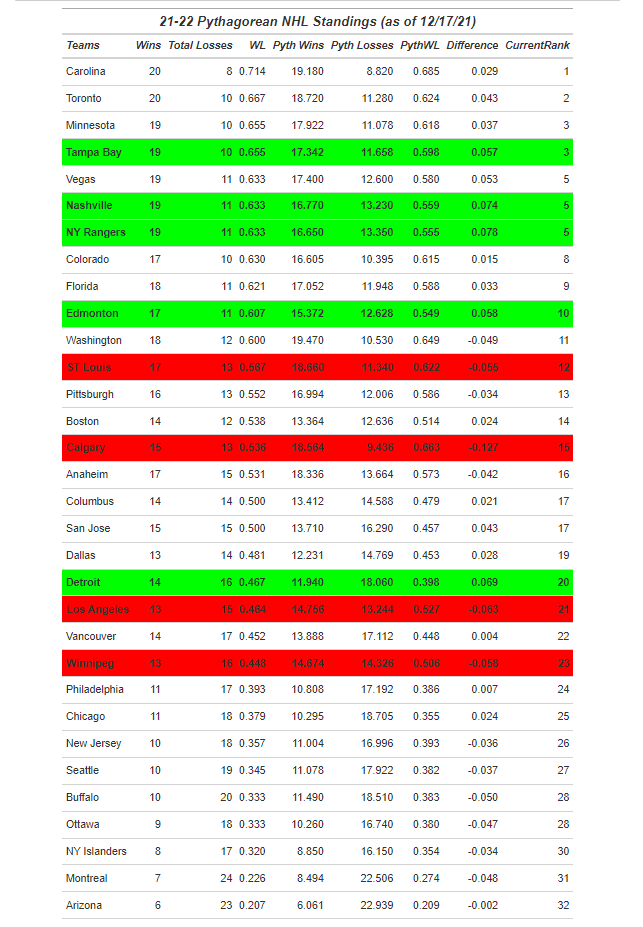
Each of the variables are fairly self-explanatory. The key column here is the "Difference" variable which is calculated by taking the actual win/loss proportion and subtracting it by the Pythagorean win ratio. Highlighted in green are the teams that have the largest difference values. This would imply that these teams are out-performing their true level of play based on their goal difference (goals scored vs goals allowed). In particular, the New York Rangers and the Nashville Predators are playing above their performance levels so far this season.
Highlighted in red are the teams that have the lowest difference values. As one would expect, this implies that these teams are under-performing their true level of play. The Calgary Flames are a particularly interesting case, as their differential of -0.127 suggests that they have been highly "unlucky" so far this season.
Next, we use the Pythagorean win ratios to predict the rest of the season for all 32 teams. Below is the data:
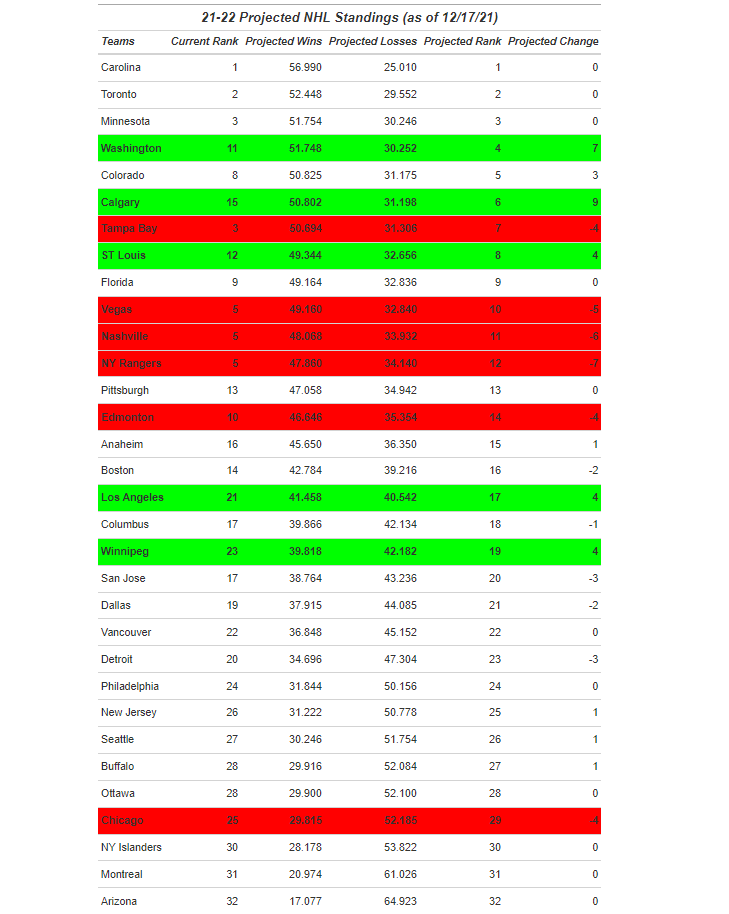
Here we have the projected final records for each team, given their current performance and predicting the remaining games for each team. The key variable here is the "Projected Change" column which takes the difference of a team's current ranking and projected ranking using Pythagorean expectation.
Highlighted in green are the teams that appear to be primed for a 2nd half of the season comeback. As suggested from the earlier table, Calgary seems to be the most-likely team to bounce back. Our predictions expect them to jump 9 spots and become a top 6 team in the overall NHL standings.
Highlighted in red are the teams that may succumb to a drop off in wins for the rest of the season. Our predictions show the Rangers, Predators, and Golden Knights as teams that could fall from the elite tier of the NHL.
Of course, adjustments over the course of a long, 82 game season are aplenty. We should expect teams to adjust which could affect level of play and Pythagorean expectation. So, don't take these predictions as gospel. However, there is enough data now to have some concerns for teams like the Rangers, Predators, Oilers, Red Wings, and Lightning and some optimism for teams like the Blues, Flames, Kings, and Jets.
(GitHub link to the data and code will be posted in the near future to this article)
Feel free to send me your thoughts on social media (Twitter: @ryank_08, Instagram: @ryan8kyaw) or email (ryankyaw6@gmail.com).


Comments